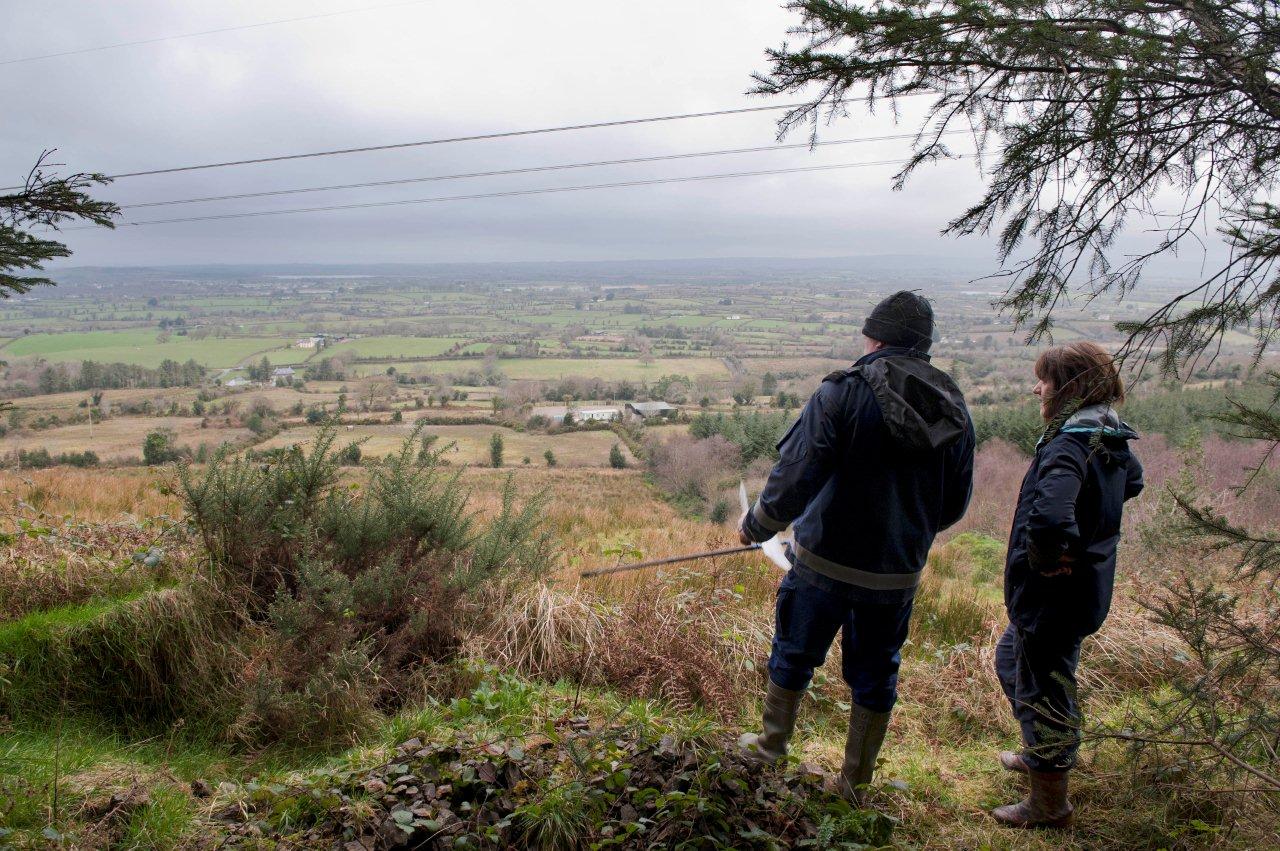
The Twelve O’Clock hills is a local and popular name for a group of hills that lie South of Kilkishen between the townland of Belvoir and the small settlement of Oatfield. The tallest hill is Knockanuartha at 309m. The walking routes presently being developed are mostly located in the townlands of Belvoir, Crag, Snaty Cooper, Snaty Wilson and Snaty Massy. Belvoir is low-lying on the banks of the O’Garney river and was the residence of the Wilsons, the former landlords of the area. Unusually, the Wilsons were Catholics. They became the Wilson-Lynchs when the family inherited land in Co. Galway. Crag is the next townland, somewhat higher than Belvoir. The land in Crag is of middling to poor quality. An extensive dry-stone wall was built of limestone, on the boundary of Crag and Belvoir.
The selection of the walking routes was helped by the existence of a roadway, now in poor condition, running in a north-south direction between Belvoir and Oatfield. This roadway was built during the Famine to provide employment to starving people. Another road was started, running from Crag in a Westerly direction towards Cooleycasey. This road was not finished. However, the track of the road can be seen and walked. On this road one can see the ruins of a settlement cluster which once had 12 houses and two lime kilns. Also, one can see the ruins of a substantial dwelling in the trees. From Crag, a road was proposed to run in an easterly direction through two settlements clusters towards Broadford. This was not built. It is clear that a significant population lived and worked in the area at some stage. Modern maps give very little clue as to where the population lived as the area we are looking at is now forestry with open areas of bog and heather on higher ground. We have to go back to the 1840s and work forward to see to see where the population lived and who they were.
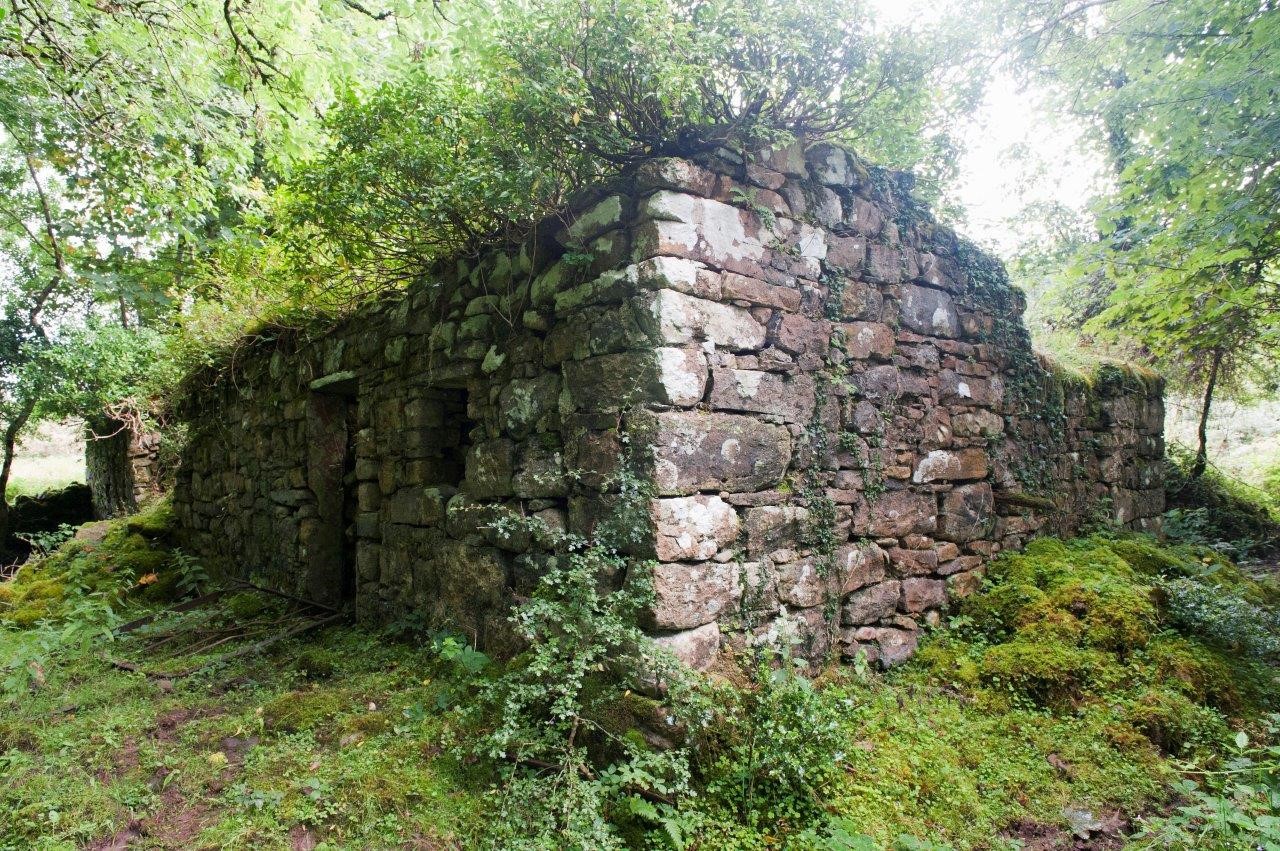
Mulready’s farm house, a well built 3-roomed house, constructed after the famine
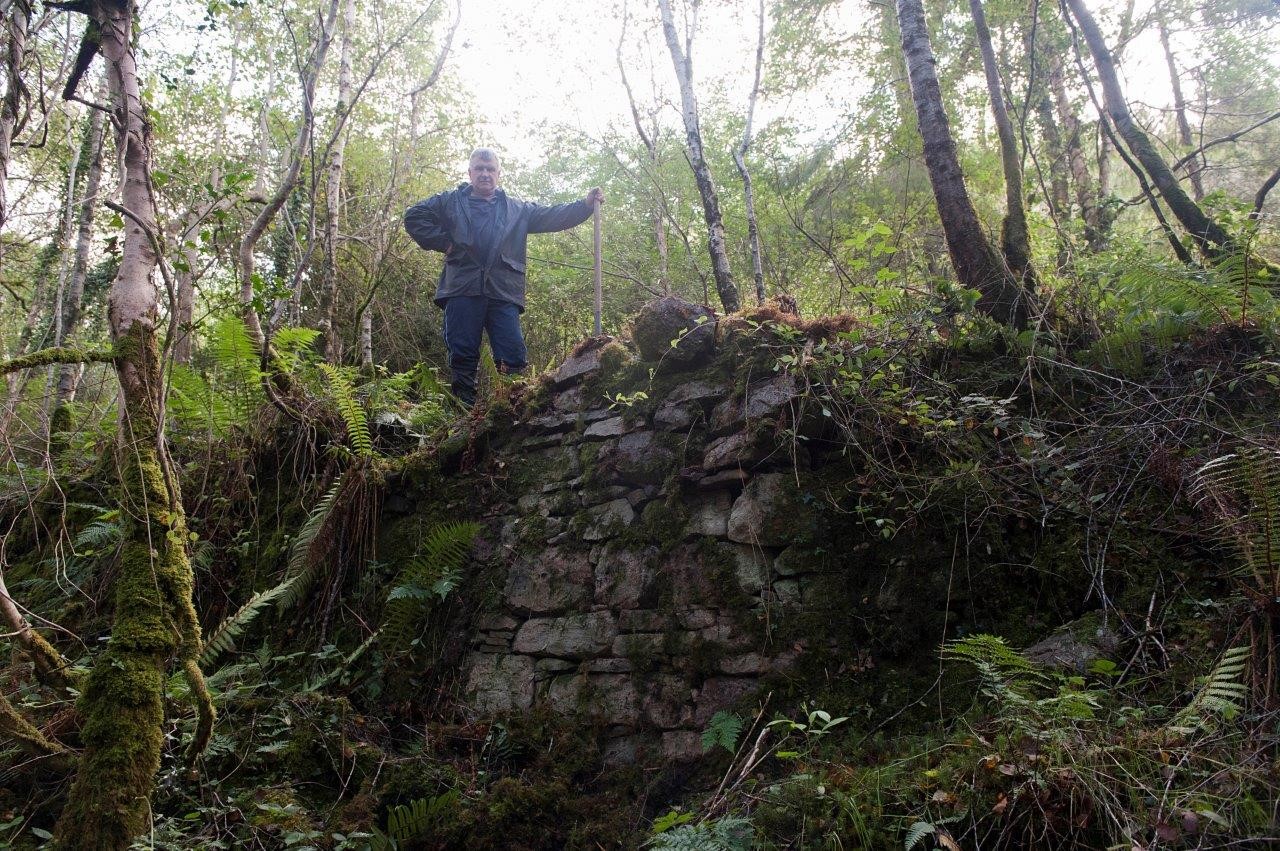
John Lyons standing on the Famine Road. Below him is the road’s retaining wall.
In the 1840s, ‘50s and ‘60s, parliament in London authorised the preparation of extensive studies and surveys of the condition of Ireland. The OS produced a set of 6” to 1 mile maps for the whole country, publishing Co. Clare in the 1840s. These maps were updated in 1893 to a scale of 25” to 1 mile. Accurate censuses were done for 1841, ’51 and ’61. During the 1840s, Sir Richard Griffith supervised the carrying out of a property tax survey, now widely known as Griffith’s Valuation. This survey produced tables of peoples’ names, land acreage and valuations. The tables were cross-referenced to plots marked up in red on the newly published OS 6” maps.
Population
The present population of our area is about 100, with almost all living in low-lying Belvoir. In 1841, the population was 600. The following table shows how the population changed in this period. The table below shows the population in our townlands for the census years of 1841, 1851 and 1861. The 1901 figures, taken from the National Archives website, are also shown for comparison.
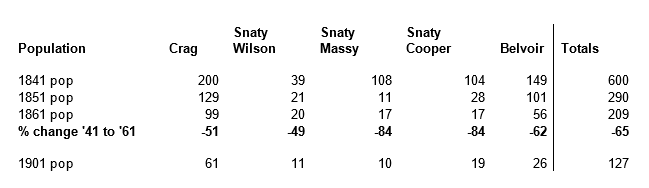
As can be seen, the total population decline was very rapid. The reason for this decline was, of course, the Great Famine of 1845 to 1852. It is interesting to note that the decline continued long after the famine finished. Landlords no longer wanted large numbers of tenants on small holdings because it was troublesome collectiong rent from very hostile people and herds of animals were more profitable. In addition, the rents on properties with a valuation of less than £5, as calculated by the Griffith surveyors had to be paid by the landlord. In our area, this represented about 20 acres of mountainous land. The landlords naturally did not want to do this and so landholders who survived the disease and starvation of the famine were encouraged to emigrate. Former small plots were combined into larger units and then rented out.
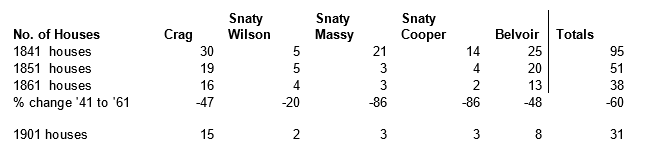
Housing
The number of houses also declined as there was nobody available to re-occupy them once they were empty. They were used as animal sheds by the people who survived and were allowed to rent land. The chart below shows the decline in house numbers. Dividing the population number of a townland by the number of houses in the townland gives an average number of people in each house.
Present State
As mentioned above, most of the present population lives in Belvoir. Forestry covers most of the higher parts, with bogs and mountainous heather-clad wet soils at the highest level. The last four families moved out in the 1970s . The location of three of these houses are on the walking trail route and may be visited. And, to end on a positive note, the fourth house has been restored and has been re-occupied.
Michael McNamara
February 2014…